The figure library

Figures you can trust — and cite

The data figures that run through the site, collected in one place. Every value traces to a named trial or an FDA label — forest plots, effect sizes, reported rates. No stock imagery, no decorative filler.

11 evidence charts · every value trial- or label-verified

Evidence charts

Source-backed data figures — every value traces to a trial or label.
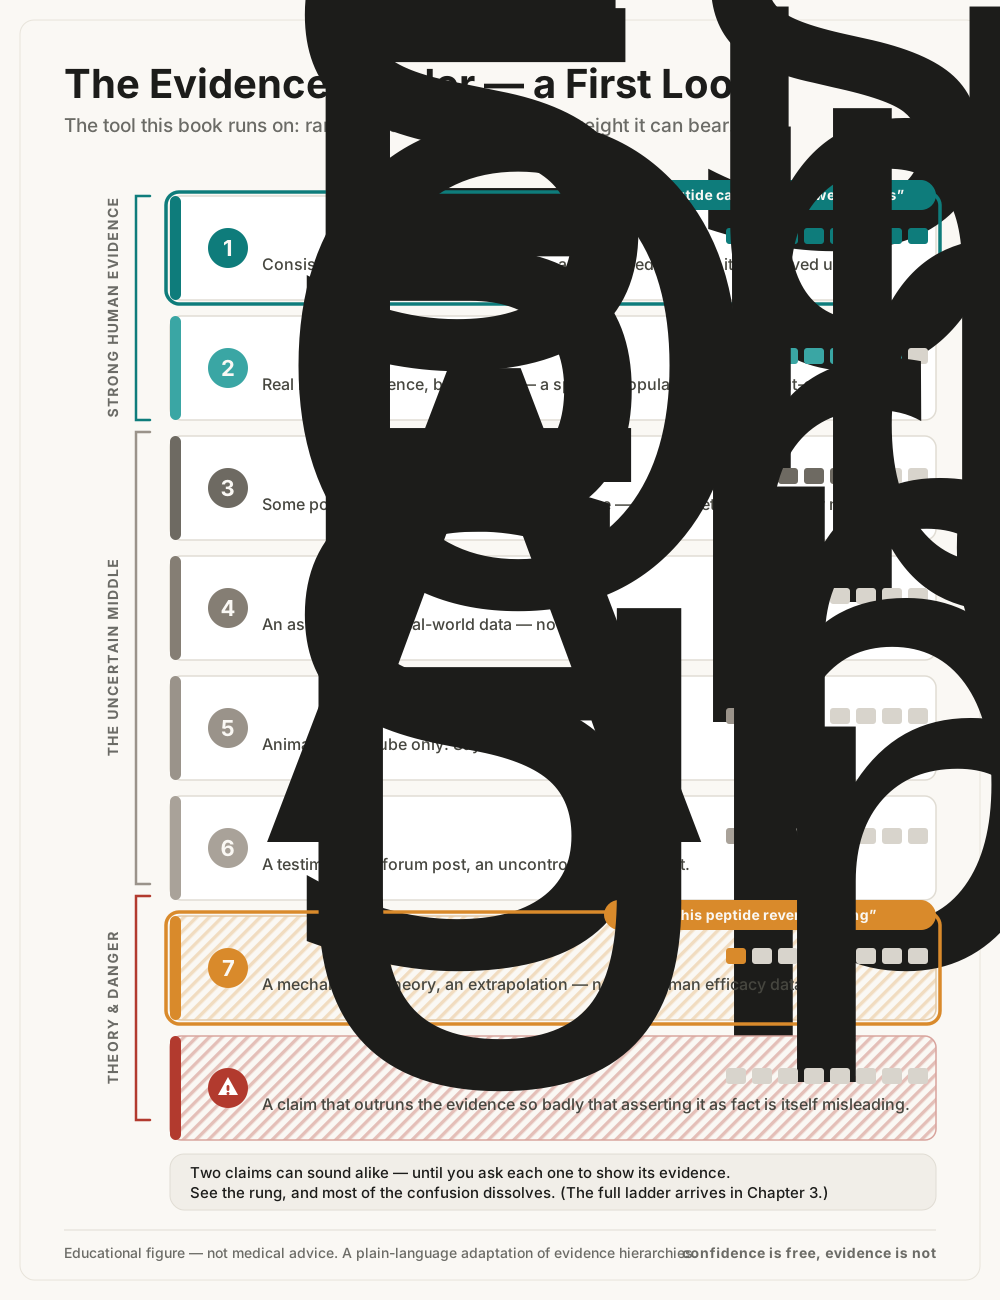
  • The Peptide Evidence Ladder: eight rungs from 'Established' (strong, consistent human evidence) at the top down to 'Unsafe to state' at the bottom — a visual scale of how much weight a claim can bear.

    The Peptide Evidence Ladder

    The 8-rung ladder every graded answer on this site runs on.

    Framework from “The Peptide Era.”

    Used on: How we grade evidence, The evidence ladder

    Download figure ↓
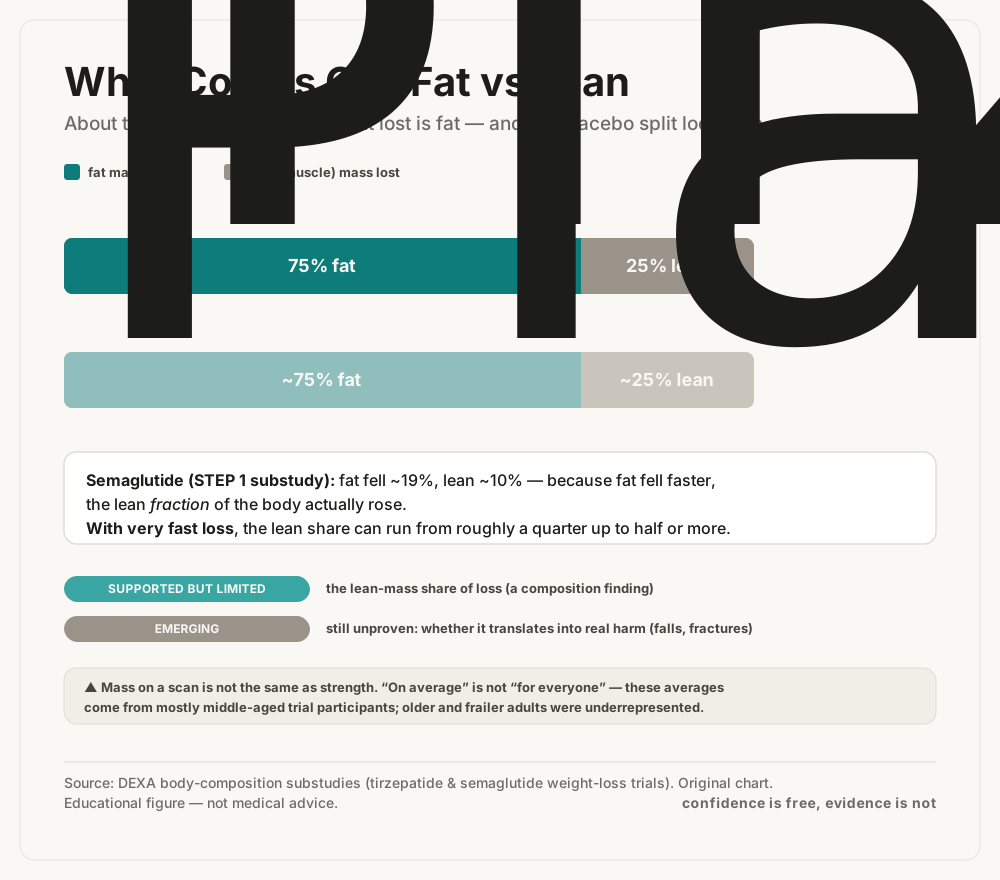
  • Chart: of the weight lost on a GLP-1, most is fat and some is lean (muscle) mass — DEXA data show the lean-mass share ranging from about a quarter with tirzepatide (SURMOUNT-1) to roughly 40% with semaglutide (STEP 1).

    Lean vs fat loss on a GLP-1

    Most of the weight lost is fat, but a meaningful share is lean mass — which is why protein and resistance training matter.

    DEXA substudies, SURMOUNT-1 and STEP 1.

    Used on: Muscle loss, Ozempic face

    Download figure ↓
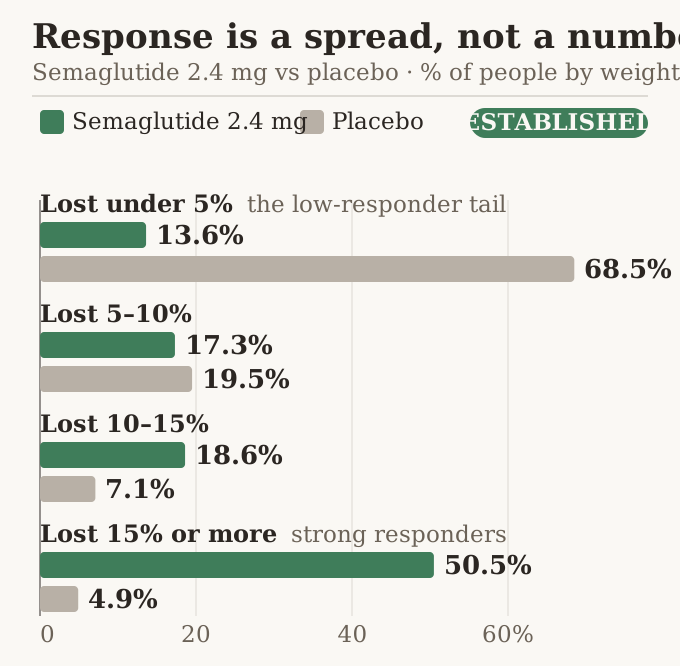
  • Grouped horizontal bar chart of the share of STEP 1 participants in each weight-loss band at 68 weeks, semaglutide 2.4 mg versus placebo. Lost under 5%: semaglutide 13.6%, placebo 68.5%. Lost 5-10%: 17.3% vs 19.5%. Lost 10-15%: 18.6% vs 7.1%. Lost 15% or more: 50.5% vs 4.9%.

    How much people actually lose (STEP 1)

    Response varies widely — half of people lost 15%+, but a real tail lost under 5%.

    STEP 1 (semaglutide 2.4 mg), 68 weeks.

    Used on: Non-responders

    Download figure ↓
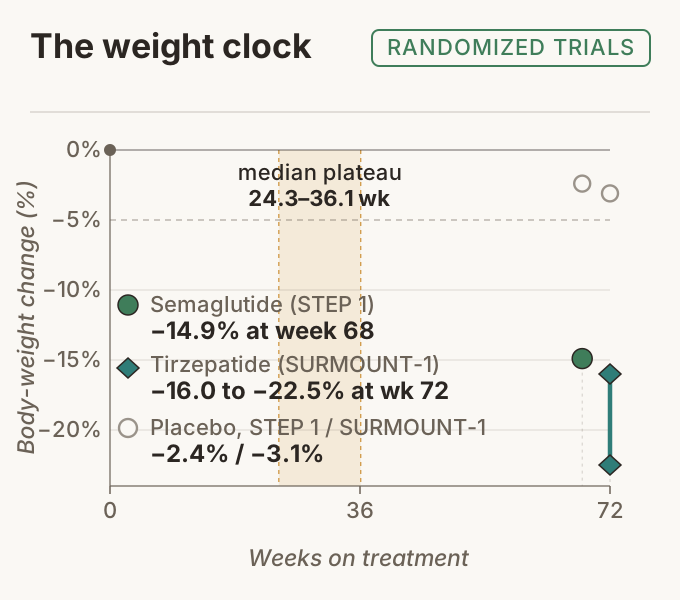
  • A milestone timeline of average percent body-weight change against trial week: baseline 0%, semaglutide week 68 at −14.9% (STEP 1), tirzepatide week 72 at −16.0 to −22.5% across doses (SURMOUNT-1), placebo endpoints −2.4% (STEP 1) and −3.1% (SURMOUNT-1). A shaded band marks where average loss stops falling, 24–36 weeks by baseline BMI.

    How long it takes to work

    The average loss keeps building for months before it levels off.

    STEP 1 and SURMOUNT-1 verified time-points.

    Used on: How long it takes, Plateau

    Download figure ↓
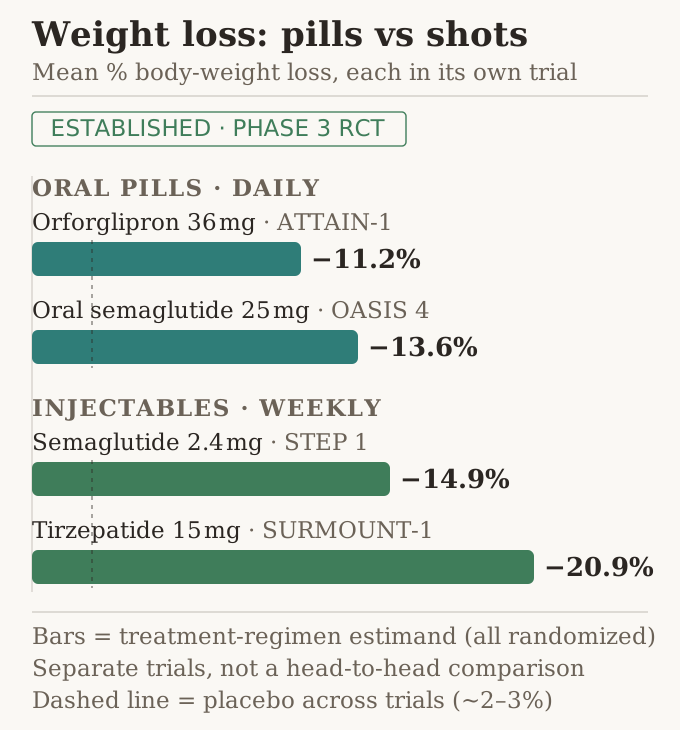
  • Horizontal bar chart of mean percent body-weight loss for four GLP-1 options by route. Oral daily: orforglipron 36 mg −11.2% (ATTAIN-1); oral semaglutide 25 mg −13.6% (OASIS 4). Injectable weekly: semaglutide 2.4 mg −14.9% (STEP 1); tirzepatide 15 mg −20.9% (SURMOUNT-1). Dashed placebo line ~2–3%. Separate trials, not head-to-head.

    Oral vs injectable weight loss

    The pills work — a bit less than the strongest injections, across separate (not head-to-head) trials.

    ATTAIN-1, OASIS 4, STEP 1, SURMOUNT-1.

    Used on: Oral semaglutide, Orforglipron

    Download figure ↓
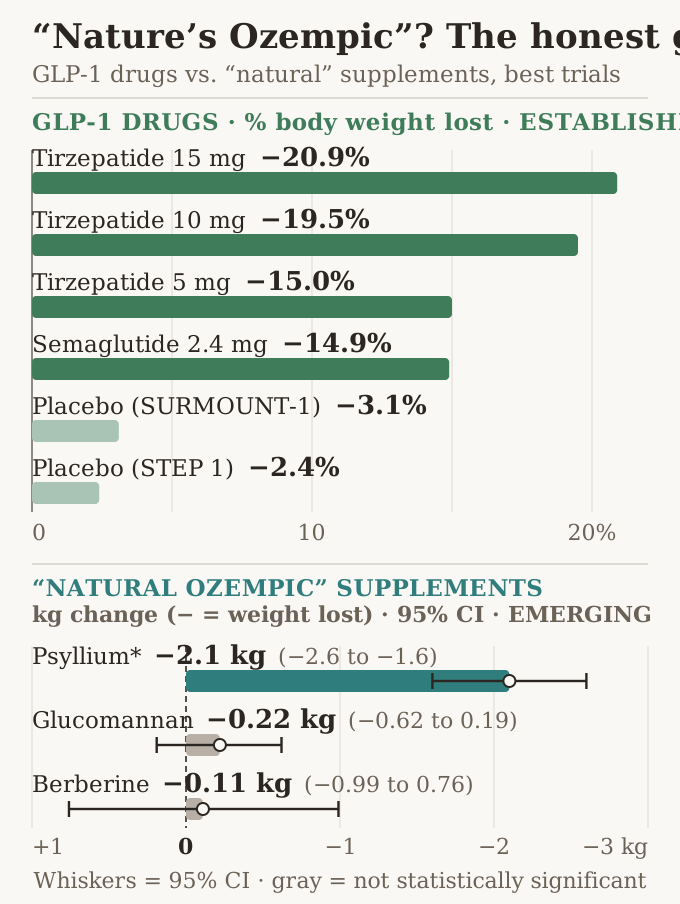
  • Two-panel chart. Top: GLP-1 medications, percent body weight lost in blinded RCTs — tirzepatide 15.0–20.9% (SURMOUNT-1), semaglutide 14.9% (STEP 1) versus ~2.4–3.1% placebo. Bottom (different unit, kg with 95% CIs): psyllium −2.1 kg (significant, but industry-funded meta), glucomannan −0.22 kg and berberine −0.11 kg — both not significant. The panels use different units and none of the supplements acts on the GLP-1 receptor.

    “Natural Ozempic” vs the real thing

    The supplement effects are tiny or null — and none work on the GLP-1 receptor.

    RCTs and supplement meta-analyses; note the different units.

    Used on: Natural Ozempic, graded

    Download figure ↓
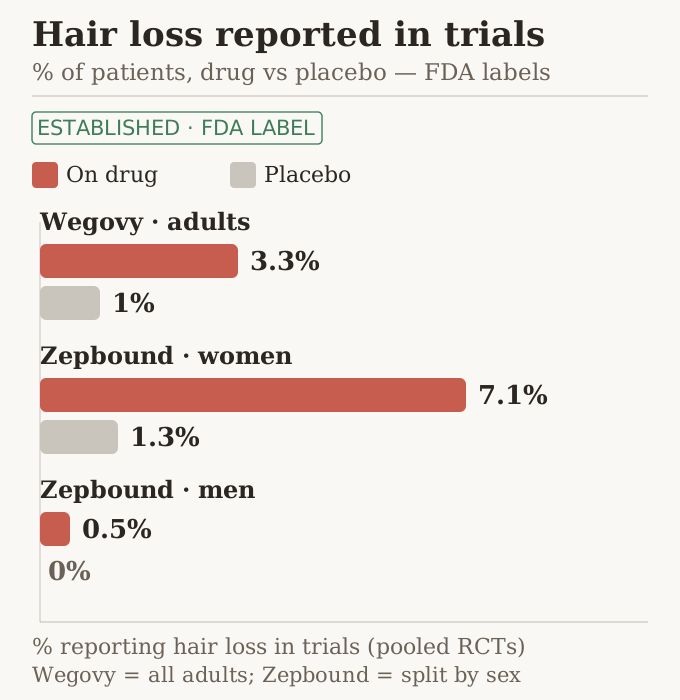
  • Horizontal bar chart of hair-loss (alopecia) rates from the FDA labels: Wegovy 2.4 mg all adults 3.3% vs 1% placebo; Zepbound women 7.1% vs 1.3%; Zepbound men 0.5% vs 0%. Rates are low single digits, higher on drug than placebo, and much higher in women than men.

    Hair-loss rates from the labels

    Real but uncommon — and it tracks the rapid weight loss more than the drug itself.

    Wegovy and Zepbound FDA labels.

    Used on: Hair loss

    Download figure ↓
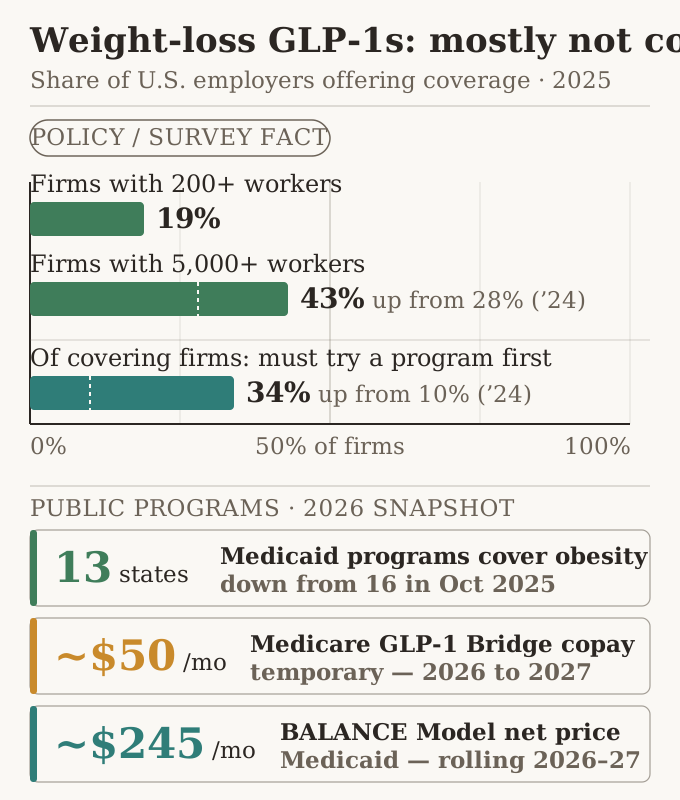
  • Bar chart of the share of firms offering GLP-1 coverage for weight loss: 19% of firms with 200+ workers in 2025; 43% of firms with 5,000+ workers in 2025 (up from 28% in 2024); and 34% of covering firms required a lifestyle program first in 2025 (up from 10% in 2024). Public-program tiles show 13 state Medicaid programs covering GLP-1s for obesity.

    The 2026 coverage landscape

    Coverage is expanding at big employers but still uneven — and increasingly gated behind lifestyle programs.

    KFF employer survey and state Medicaid data, 2024–2025.

    Used on: Coverage cliff 2026, Cost & access

    Download figure ↓
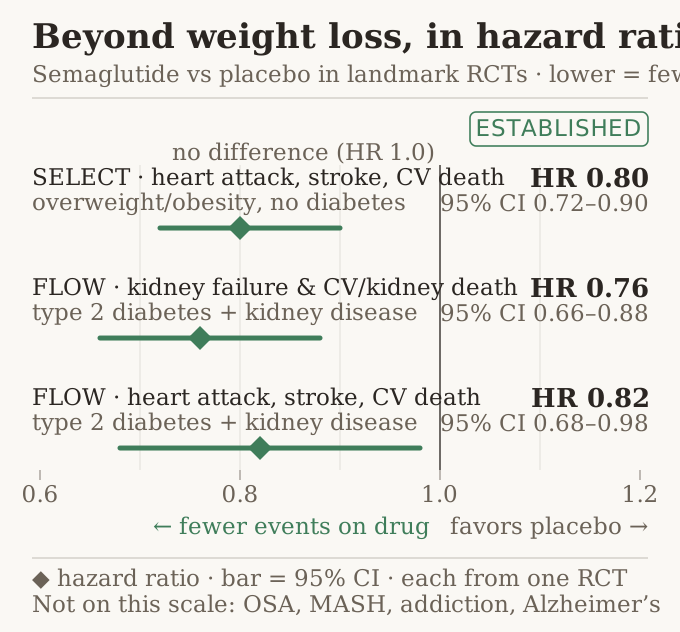
  • Forest plot of three semaglutide-versus-placebo hazard ratios. SELECT major heart events HR 0.80 (0.72–0.90); FLOW kidney composite HR 0.76 (0.66–0.88); FLOW major heart events HR 0.82 (0.68–0.98). All point estimates and confidence intervals sit left of the 1.0 line — fewer events on the drug.

    Outcomes beyond weight loss

    The strongest non-weight benefits: fewer heart and kidney events in dedicated outcome trials.

    SELECT and FLOW trials.

    Used on: Beyond weight loss

    Download figure ↓
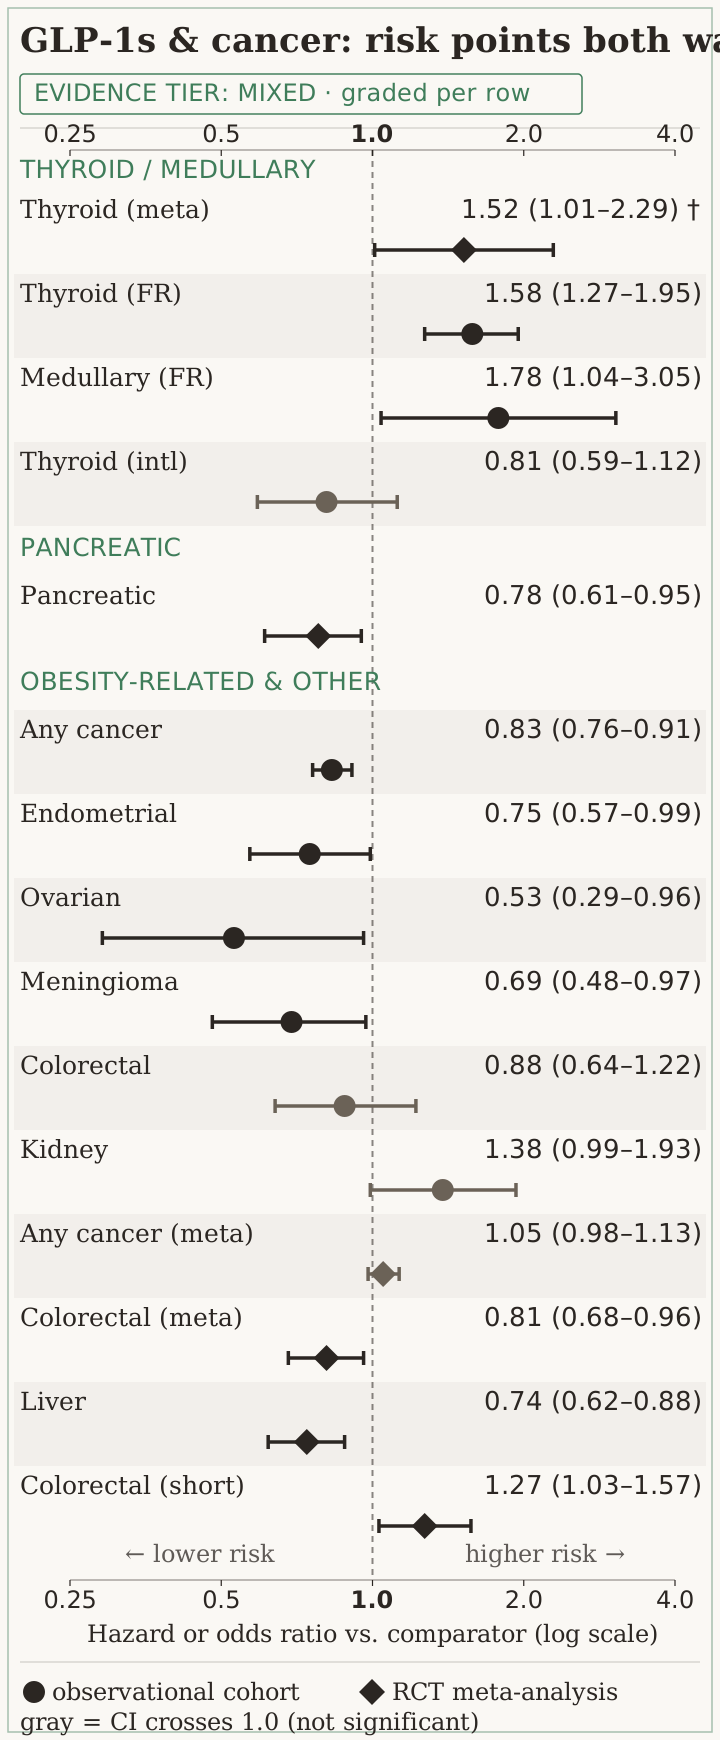
  • Grouped forest plot of 15 reported hazard or odds ratios for GLP-1 receptor agonists versus a comparator, on a log axis with a no-difference line at 1.0. Circles mark observational cohorts, diamonds mark RCT meta-analyses; gray markers cross 1.0 and are not statistically significant.

    Cancer signals, in context

    Most cancer signals are null or protective; the thyroid signal is small and uncertain.

    Observational cohorts and RCT meta-analyses.

    Used on: Cancer risk

    Download figure ↓
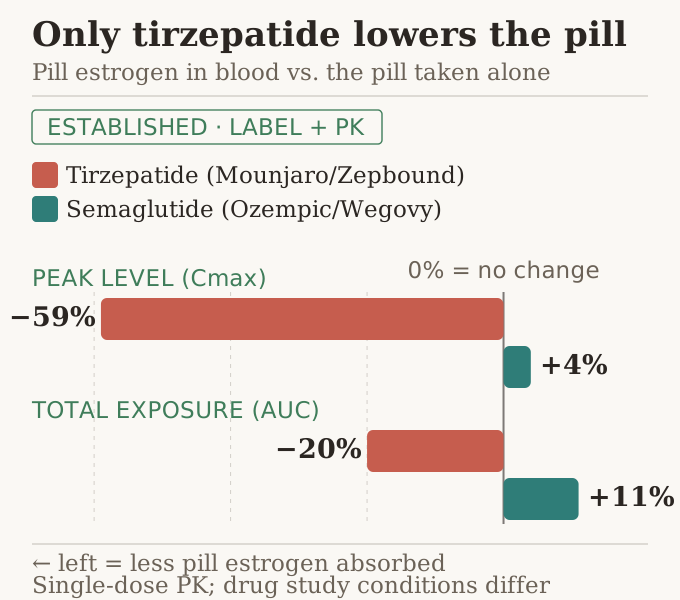
  • Diverging bar chart of the change in blood levels of ethinyl estradiol from a combined pill caused by two GLP-1 medicines versus the pill alone. Peak (Cmax): tirzepatide −59%, semaglutide +4%. Total exposure (AUC): tirzepatide −20%, semaglutide +11%. Bars left of zero mean less pill estrogen absorbed.

    GLP-1s and the birth-control pill

    Tirzepatide can lower oral-contraceptive absorption; semaglutide does not — an under-discussed interaction.

    FDA label pharmacokinetic data.

    Used on: Birth control, Periods & fertility

    Download figure ↓

Figures are from “The Peptide Era” and its companion site, free to view and quote with attribution. They are educational, not medical advice.